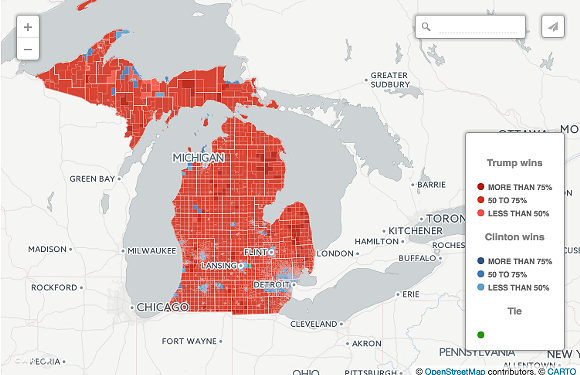
Take a look at this map created by Bridge magazine and the results look pretty cut and dry. Michigan's electoral votes definitely went to Trump.
But if you take a closer look, a deeper story comes into a focus.
The interactive map shows just how divided the state really was when it came to the 2016 election. Trump won narrowly with only about 10,000 more votes than Clinton.
Take a close look and you'll see very few precincts marked with the deep red that signifies Trump won with more than 75 percent of the vote. An astounding majority of precincts are marked with a light red, meaning Trump and Clinton voters really went head-t0-head.
And then there are the blue marks. They are few, but they speak volumes. As the Bridge article notes, many of these blue precincts are directly next to deep red ones, meaning close neighbors and communities had deeply contrasting views.
On the west side of the state lies the perfect example. Neighboring townships Yates and Chase share a border, yet they voted in stark contrast. Yates, marked blue, tallied over 63 percent of their votes in favor of Clinton while Chase went red with 76 percent of the vote.
The map is interactive, so you can type in your zip code and see how your city and precinct faired. Click here for the map and full story from Bridge.

Audio By Carbonatix
[
          {
            "name": "GPT - Leaderboard - Inline - Content",
            "component": "35519556",
            "insertPoint": "5th",
            "startingPoint": "3",
            "requiredCountToDisplay": "3",
            "maxInsertions": 100,

            "adList": [
              {
                "adPreset": "LeaderboardInline"
              }
            ]
          }

        ]


